IELTS writing task 1 is the first part of the IELTS Writing module. It calculates to only 33% of the writing marks. Task 1 is different for the Academic and General modules. The difference between the modules are given below:
IELTS Academic writing task 1
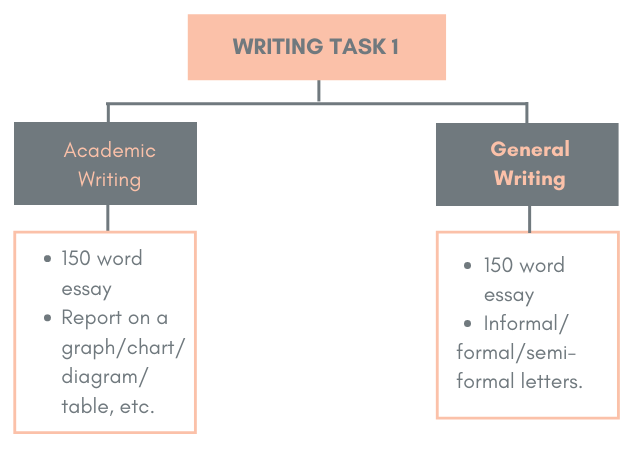
In the IELTS Academic writing task 1, you will be provided with a graph/chart/diagram for which you would have to write a 150-word description.
IELTS General writing task 1
In the IELTS General writing task 1, you will have to write a letter for 150 words.
Do not go beyond 20 minutes on it as you would need around 40 minutes to complete Writing Task 2. IELTS Writing Task 1 marks are evaluated based on task achievement, coherence, cohesion, vocabulary, and grammar.
Before you begin your IELTS writing task 1, you should be conscious of the following:
- Read the question and instructions carefully before you begin the task.
- Look at the chart/diagram/graph carefully and process the information.
- Start planning on the structure and details for the task.
- Recall what you know about the structure of writing task 1 (which is given further down this page) and be mindful of the information that has to go into each paragraph.
- Pay attention to spellings, grammar, sentence types, lexical resources, coherence and cohesion, fillers, etc.
PRO TIP: If you cover your diagram/graph/chart, you should be able to replicate the key points or major changes of the diagram/graph/chart with the description that you’ve written.
IELTS Writing Task 1 Preparation Tips
The IELTS writing task 1 can be written by considering the following points
- Firstly, you need to analyze the visual that is given and understand the question properly before you start writing the answer.
- Secondly, there will be a particular structure that should be followed by the test taker while taking up the IELTS test. This can help you get a good band score.
DIFFERENT SECTIONS OF TASK 1
Also check: IELTS General writing task 1
IELTS WRITING TASK 1 SCORES
In IELTS writing task 1, you are asked to write a summary of 150 words in response to the graph, table, chart given, or letter in response to the situation given. This task tests your ability to identify the main features, to compare the data, or to describe the trends. When it comes to describing visual representations or writing letters, the scores are not only based on how well you write but also on the aspects of coherence, range of vocabulary, grammar, etc. The below-given tables provide you with information on how your answer is graded with respect to each grading element:
Task Achievement(Writing Task 1) and Task Response (Writing Task 2):
| Band score | Task Achievement |
|---|---|
| Band 5 |
|
| Band 6 |
|
| Band 7 |
|
| Band 8 |
|
Coherence and Cohesion:
| Band score | Task Achievement |
|---|---|
| Band 5 |
|
| Band 6 |
|
| Band 7 |
|
| Band 8 |
|
Lexical Resource:
| Band score | Task Achievement |
|---|---|
| Band 5 |
|
| Band 6 |
|
| Band 7 |
|
| Band 8 |
|
Grammar Range and Accuracy:
| Band Score | Task Achievement |
|---|---|
| Band 5 |
|
| Band 6 |
|
| Band 7 |
|
| Band 8 |
|
THE BASIC STRUCTURE OF IELTS ACADEMIC WRITING TASK 1
There is a particular structure to describe a task in IELTS academic writing task 1. You can follow the below structure for the 150+ word description.
Introduction
Like an essay, the description too needs an introduction.
Points to remember when you write an introduction:
- This paragraph should focus on the components of the graph/bar chart/ table/ process/map etc.
- To write this paragraph, you should read and understand the question given.
- Do not use the exact words given in the question, instead paraphrase the question.
- Using synonyms for the important words given in the question could get you extra points!
- If there is a time frame mentioned, do not forget to mention the time frame in your paragraph.
Let’s take this pie-chart question as an example:
Question
| You should spend about 20 minutes on this task.
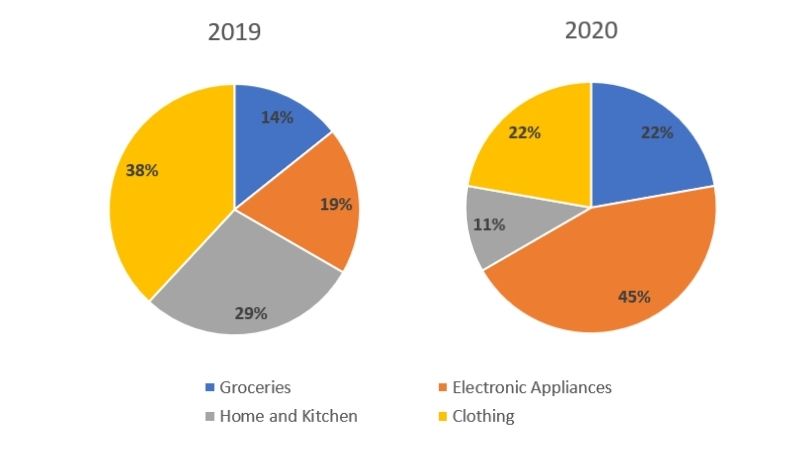
The pie chart shows the online sales for retail sectors in Canada in the year 2005 & 2010. Summarize the information by selecting and reporting the main features and make comparisons where relevant. Write at least 150 words. |
Chart
Introduction paragraph
The charts compare four retail sectors which are Electronics & Appliance, Food & Beverage, Home Furnishings and Video Games in Canada in terms of the proportion of their internet sales in two years, 2005 and 2010.
Overview:
The overview paragraph stands true to its name. In general terms, you must be able to identify the main features and need to focus more on them so that you can score a high band.
Points to remember when you write an overview:
- This is the most important paragraph.
- Identify the key features of the graph (highest point, lowest point, etc.)
- Focus on the features that stand out in comparison to the other features.
Example of an Overview paragraph
Overall, the proportion of online sales for each of the four sectors changed significantly from 2005 to 2010. While the figures for food and beverages and also video games increased, the figures for the other two sectors fell.
Paragraph
The body paragraph has to provide information explaining the features that are identified. If there are more than 1 graph, you can add the paragraphs accordingly.
Points to remember when you write a paragraph:
- The number of paragraphs depends on the information/data given.
- Use appropriate vocabulary to compare and describe the data.
- Check if the graphs follow a pattern (mostly line graphs/bar charts) and make sure you mention the pattern.
Example of body paragraphs
In 2005, the proportion of online sales of food and beverages was 22%, but this rose to 32% in 2010. The percentage for internet sales of video games also went up, by 5% from the 2005 figure of 18%.
In contrast, the percentages of the online sales of the other sectors decreased. The most dramatic fall was in the home furnishings retail sector. While this figure was 25% of the total online sales of these four sectors in 2005, it fell to just 15% in 2010. There was also a decrease in the electronics and appliances sector, which saw a fall from 35% in 2005 to 30% in 2010.
TYPES OF GRAPHS IN IELTS WRITING TASK 1
The graphs in IELTS Writing Task may be different, they are given as follows.
Graphs Overtime
The first thing you’ve got to do with graphs is to check if they have a time frame. Plan your answer/report according to the time frame. When a time frame is involved, make sure you use vocabulary related to change or comparing and contrasting.
TIP: It’s not enough if you describe all the data individually, you should compare the data.
- Recent IELTS Writing Task 1 With Model Answer – Line Graph
- IELTS Writing Task 1 Model Answer From British Council – Bar Charts
IELTS Pie Chart
An IELTS pie chart is a type of graph in which a circle is divided into sectors that each represent a proportion of the whole. You will also be provided with a key below the chart with the names of the categories or the categories would be written in the actual pie chart. In this chart, you need to compare the categories together across the chart, writing about the similarities and the differences together. Remember to use your vocabulary accordingly, use words that convey proportions, amounts or change in numbers. It would make more sense if you begin with the more important category to the less important category.
- IELTS Academic Writing Task 1 (Pie Chart) & Band 9 Model Sample
- Academic IELTS Writing Task 1 – Pie Charts & Band 8.5 Model Answers
IELTS Process
The IELTS process diagram is an uncommon question in the IELTS Writing Task 1. There isn’t a different structure to follow while you’re writing about a process. It’s the same as the others:
- Introduction – Introduce the process, explain what the process is about.
- Overview – Mention the number of stages, the starting and ending point.
- Body paragraphs – Describe a series of events in the flow, also use appropriate language (i.e) time connectors.
- To begin…
- Then …
- Following this…
- Finally…
- IELTS Academic Writing Task 1 (Process) & Band 9 Model Sample
- Academic IELTS Writing Task 1 – Process & Sample Answers
Two Graphs together
One of the common Task 1 questions would be getting two graphs together. In this question, you would have to focus on both the graphs – mention the information on both the graphs, locate and state the key features of both the graphs. However, unlike the other graphs, you do not have to describe everything that you see in the graphs. Pick out the important information and summarize it properly.
TIP: The most important Vocab range that you should learn/use for this question is the words used for compare and contrast.
- Academic IELTS Writing Task 1 – Multiple Graphs & Model Answer
- Sample Essay For Academic IELTS Writing Task 1 Topic 43 – Bar Chart
IELTS Tables
The table chart is just another way of showing information. The comparison and the language of change will be the same as the graphs. You do not have to learn a new way or language to describe the table chart. In this, you need to find out the significant data and main features and not describe everything the way you see it.
| Type of products sold | Napkin packets | Oranges | Ketchup | Fenugreek packets |
| Number of products sold per day | 500 | 1000 | 200 | 800 |